The Software for Emission Spectrochemical Analysis (below it will be called as abbreviation SESA) can be used as software of spectrometers compatible
with ARL 3460 or spectrometers with measuring system S-525 or S 527, but it can be adapted to other spectrometers.
Necessity for calibration is appearing when previous calibration became not vary good or when is appearing necessity to analyze new alloys or after upgrading measuring system of spectrometer. The table of concentrations and spectrum intensity of standards is the source information to calibrate a spectrometer. Deep knowledge of mathematic, physics and spectral analysis must be studied to correctly calibrate spectrometer by this table. Furthermore, it takes very long time even for competent analyst.
The SESA has some enhancements that allow you to calibrate spectrometer accurately, easily and quickly:
- The automatic and manual search of matrix correction.
A spectrometer with software SESA can be automatically calibrated by pressing one button. The software chooses the shape of curve, the most suitable analytical lines (of established) and reference lines for them. Software defines the influencing elements and coefficients and types of influence. Calculations of multivariable regression are made by the orthogonal polynomials by Chebyshev which are converted to algebraic polynomials at a final stage - Consideration of unnotified concentrations in standards set.
This method can be used when concentrations of some elements in standards are unknown. Actually, not always full information about the chemical composition is notified in certificate of standards set. Furthermore, sometimes it is desirable to add to standards set some samples, which concentrations of some elements were gotten by chemical or other methods. If to not consider unknown concentrations, the significant mistake falls into the analytical program when occur the calculation of matrix correction and normalizing to 100%. This method not the same as just define unknown concentrations by spectrometer because in that case these values not participate in recursion of matrix correction. - Size and transparency of graph
window is changeable for applying and comparing the graphs, designed under
different conditions or methods of analysis.
- The convenient assortment of
analyze methods.
The program can operate by logarithmic and linear scales with absolute and relative values, using single or piecewise approximation. Any graphical and tabular data can be excepted and included in analysis by mouse click. Scale of the graph and weight of a standard point on the graph are changeable by mouse wheel.
The SESA has integrated help
system and operates with database SQL of local network: creation and deleting
of tables, reading, writing, deleting, and correction of records. The program
has important abilities of original spectrometer software (it observes
parameters of spectrometer, uses spectral lines of an element according to its
concentration etc.) excluding internet connection.
The SESA is written by C# safe
codes and is designed for work under Windows with Framework.NET v.2.0 or higher. This program
does not require installation and just is run by executable file. The program is easy to learn and to use.
The free edition of SESA can process analytical files with and without connection to spectrometer.
This program can operate ARL-3460 with software Win OE according to document “INSTRUMENT CONTROLLER PROTOCOL SPECIFICATION” that comes with spectrometer. Spectrometers with software OXSAS have other protocol,
therefore this program can not operate such spectrometers.
If you want to download demonstration freeware, please click here: Download
The test analytical program can be downloaded with the demonstration file.
It contains intensity and concentration of simulated standards with the mutual influence of elements. The SESA must find the influencing elements, types and coefficients of the mutual influence of the elements that are built into the test. The explaining document describes how the test was created.
If you have any questions, please ask me by e-mail. If you need, I can adjust the program to your alloys and train you to use it.
Shamil R. Musin
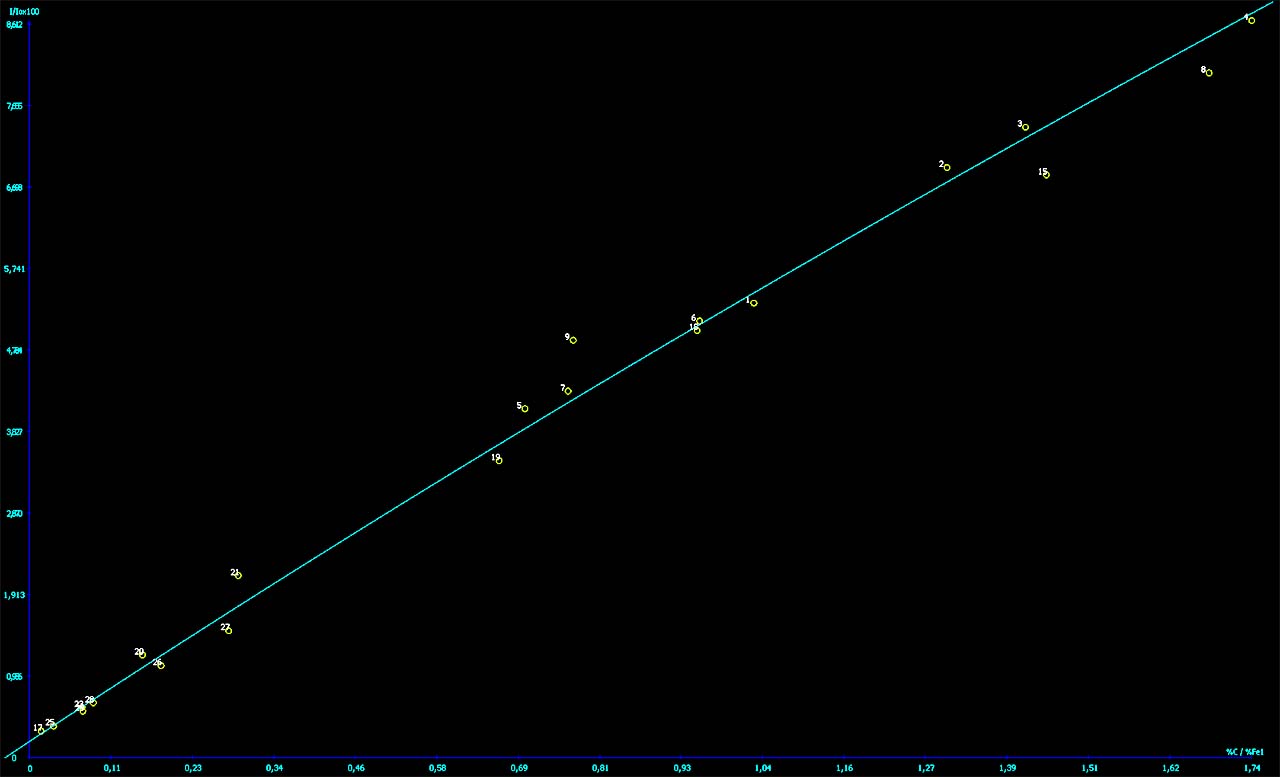
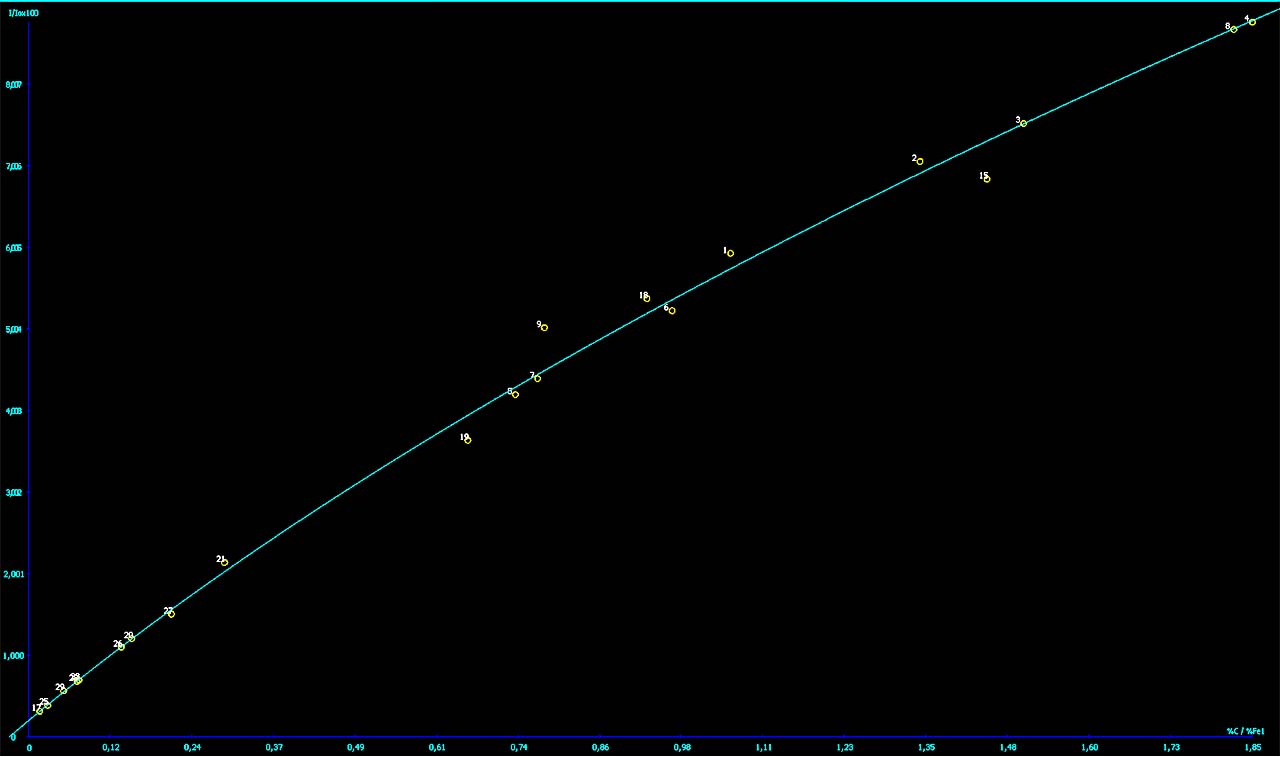
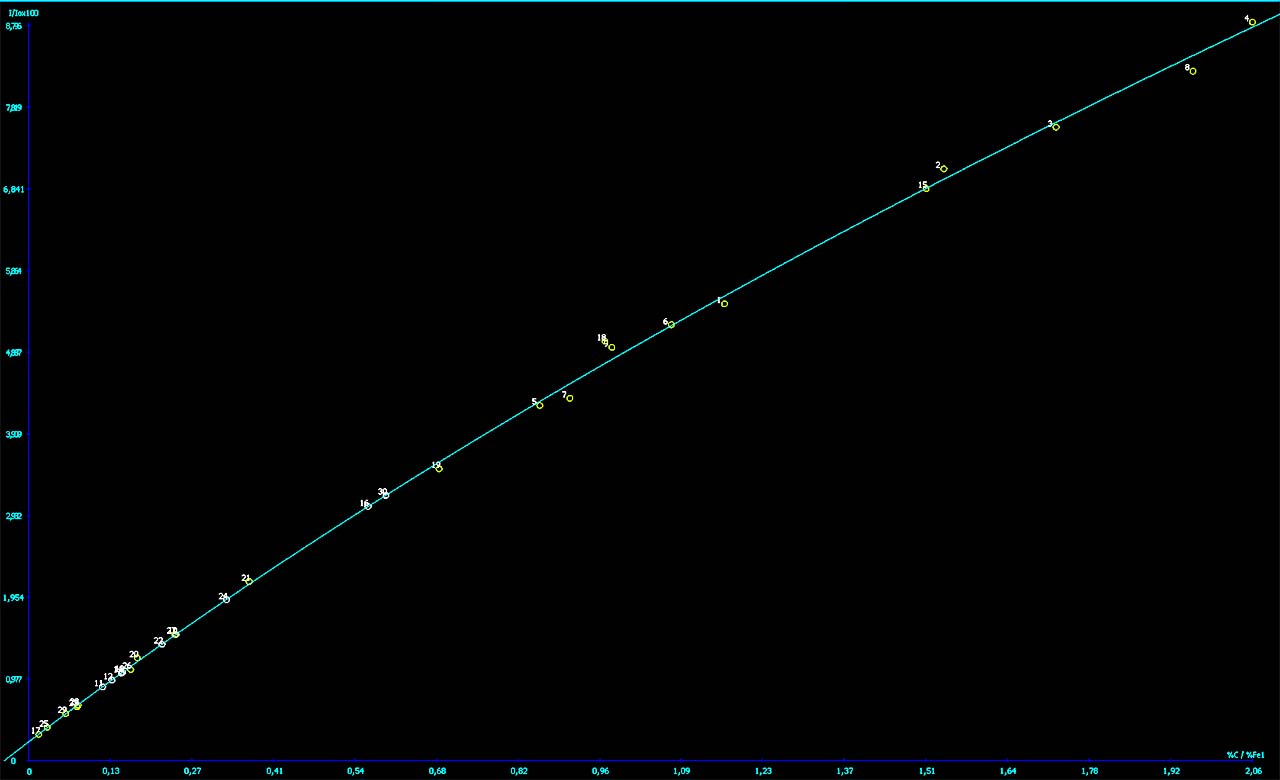
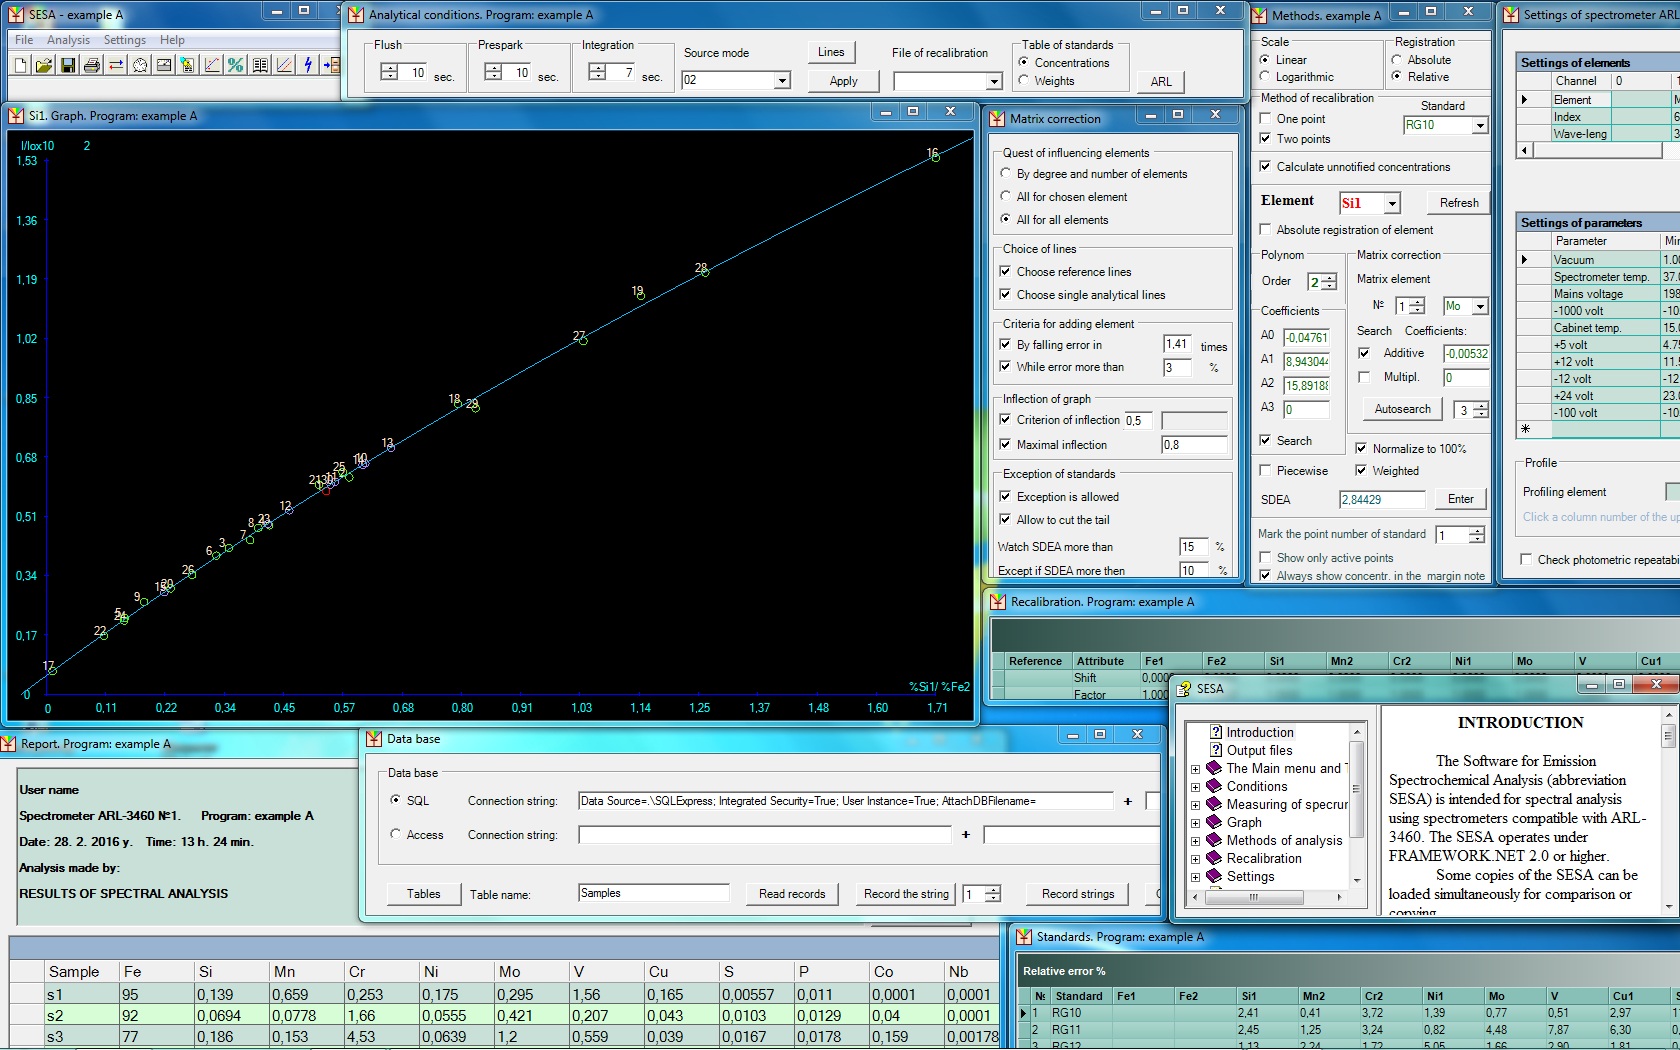
Windows of the program